Unlike here in Victoria, Transport For NSW regularly releases detailed patronage data.
I was wondering how Sydney’s new light rail line (L2, CBD to Randwick, opened mid-December) is performing, so I took a look at the figures. Despite a number of technical problems, the line had than 1.2 million trips in January, which seems not too shabby.
How does that compare to Melbourne’s busiest tram routes?
Unfortunately comparable data is hard to find, but back in 2018, the Victorian Greens did an FOI on tram patronage data, and the figures which came back included annual patronage for 2016-17. A good basis for a comparison, with some caveats.
- Melbourne tram patronage overall (as seen in the Budget Papers) has grown only about 1% between 2016-17 and 2018-19, so I didn’t bother to adjust the figures. The last big surge was 2014-15 when the Free Tram Zone was introduced.
- I initially excluded routes 8, 55 and 58, as in May 2017 routes 8 and 55 merged to become the 58. But instead I’ve taken the 58 figure for May-June and multiplied by 6.
- It would be nice to see some more up-to-date data for Melbourne – the recent deployment of larger trams may have seen patronage on some routes increase in the past year as the constraint of overcrowding is relieved.

- The NSW data is incomplete or likely to be inconsistent, as the new line only just started, and the Newcastle line is also pretty new.
- So I used the numbers from January and multiplied it by 12 – January might be quieter than a typical month, but it actually gave a higher figure overall for the L1 inner west/Dulwich Hill line and the Newcastle line than their actual patronage over the past year.
- The L3 line will open in coming months, as a branch of L2, and boosting frequency over the common section into the CBD, so expect further strong growth in Sydney.
- Important: this NSW data includes Opal only, and excludes trips using other types of tickets.

- Adelaide’s tram network is confusing. It used to be just the one line to Glenelg. Now they confusingly listed as four different acronyms on the web site (why not route numbers?), but the route map and the printed timetable booklet which could help you make sense of it only shows three of them.
- In any case, I could only find an overall patronage figure for Adelaide trams, so that’s what I’ve used.
- Proposed Adelaide tram extensions seem to be on hold at the moment.
- Gold Coast Light Rail saw heavy growth in 2018 thanks to a line extension and the Commonwealth Games, which may mean it dropped in 2019. They’ve got another line extension probably coming soon, which should boost patronage.
- I initially missed Canberra. Have updated the graph.
- I did not include tourist trams in Ballarat, Bendigo, and elsewhere (Whiteman Park, WA, and St Kilda, SA, spring to mind). I’m more interested in actual public transport (though Melbourne’s City Circle route 35 is included)
It’s somewhat arbitrary to look at just trams, of course. In Brisbane and Sydney, they have very extensive inner-city bus networks which replaced their old tram networks, and still serve a similar role to Melbourne’s trams.
And remember, route lengths vary widely, which affects boarding numbers.
But with the above caveats in mind, how do things look?
Clik here to view.
Some observations:
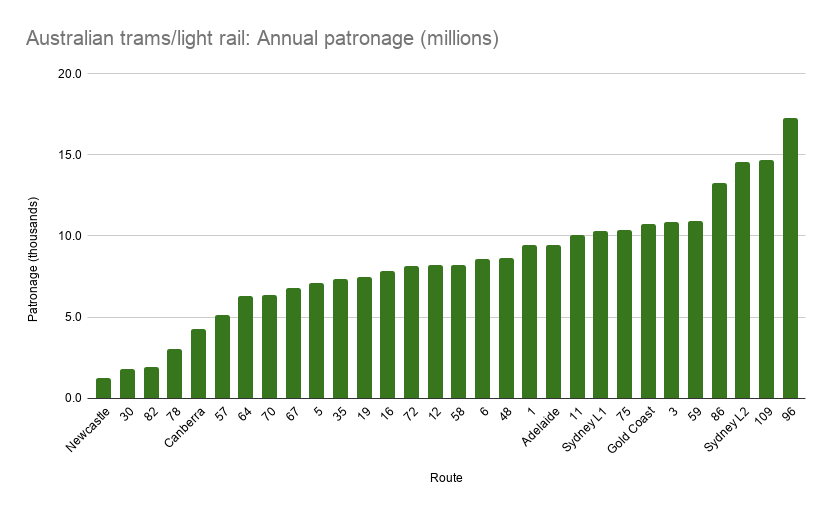
The busiest two tram routes in Australia are in Melbourne: the 96 (St Kilda to Brunswick) and 109 (Port Melbourne to Box Hill) – but the brand new Sydney L2 (City to Randwick) line isn’t far behind.
Sydney L2 replaced a number bus routes. The south-west ends of 96 and 109 replaced heavy rail lines, though the north/eastern ends of those lines date back many decades.
Sydney’s older L1 (City to Dulwich Hill) line also performs quite well, between Melbourne’s extremely long 75 (City to East Burwood) and route 11 (City to West Preston).
Adelaide’s small network sits somewhere in the middle, and the Gold Coast line isn’t too far off the middle as well. Edit: More up-to-date figures (see comments) show the Gold Coast line patronage is growing fast, and is well within the top ten.
Canberra’s relatively new line is increasing, but still not too high compared to Melbourne routes.
The least patronised lines in Melbourne are the 78 and 82 (neither of which serve the CBD) and the very short route 30 (Latrobe Street), almost all of which is duplicated by route 35 (City Circle).
Newcastle’s short 2.7km line has the lowest patronage in the country.

Can Melbourne keep up?
Melbourne might be Australia’s fastest growing city by population, but Sydney is out-performing us on public transport, with much stronger patronage growth – and has been stronger overall for some years.
Here’s a comparison of total public transport patronage for 2018-19:
Clik here to view.
- Note how Sydney’s trains and buses easily outstrip Melbourne’s trains, trams and buses.
- The Sydney Metro line opened during this period, but in part replaced a section of the Sydney Trains network. Expect strong growth in coming years.
- I’ve included half of V/Line patronage (eg trips in outer-suburban Melbourne), not that it makes a huge difference overall.
Apart from Sydney’s patronage being higher, it’s also growing faster. Why is that?
Sydney’s new infrastructure (metro and light rail) is helping, but also there’s been a big focus on service frequency on both new and existing lines, particularly outside peak periods. Sydney’s (heavy rail) stations are now mostly served by trains every 15 minutes or better until midnight – a long way ahead of Melbourne’s mostly half-hourly evening train services.
It’s a similar story on Sydney’s tram lines, with services every 15 minutes in the evenings – better than Melbourne’s 20 minutes (Monday to Saturday) or 30 minutes (Sundays). Melbourne’s daytime weekend tram frequencies are slightly better than Sydney’s L2, but the opening of the L3 line will double for the common section of the route.
The focus on increasing frequencies and cutting waiting times just isn’t happening in Melbourne.
Individual routes are getting service upgrades, but for all the talk of the metro tunnel and the Suburban Rail Loop to have turn-up-and-go services, the opportunities to deliver that right now by and large are not being delivered.
Melbourne also could and should be addressing traffic priority for trams, and more aggressively resolving accessibility issues.
And we should be extending suburban tram routes to more logical termination points. Quite a few fall short of railway stations due to rivalry between the railways and tramways last century. Enhancing overall public transport network connectivity like this would help boost patronage where it can be easily accommodated, at the less busy outer ends of routes.
Expect strong tram patronage growth in Sydney when the L3 line opens later this month.
And don’t be surprised if soon, Australia’s busiest tram route is in Sydney, not Melbourne.